Stock Market Indicators and Oscillators
Stock market indicators provide useful additional information about stock market trend, momentum, volatility and other aspects of technical analysis.
Stock market indicators are secondary or additional information to basic (price and volume) technical analysis of securities. Indicators are calculated out of the price or volume and can measure trend, trend changes, momentum and volatility for example. Idicators are most often used in combination with basic analysis of price movement and chart patterns; they are used as confirmation to the primary signals, professional rarely use them as the only information upon which they build their trading strategy.
Two types of stock market indicators exist. Those that are proceeding price movements and are the most useful in sideways trend - they are called 'leading' indicators and those that are confirming price movements - we call them 'lagging' indicators and are the most useful in uptrend or downtrend.
Indicators and oscilators are usually plotted on the graph in a separate pane. Some of them have bounded y-axis values, between 0 and 100 for example, and we call them oscillators. The stock is treated as overbought near 100 values and oversold near 0.
As you are already aware of, buy and sell trading signals are formed when the stock market price crosses moving average or when short and long-term moving average cross each other (you can read more about trading moving averages in a separate article). The other situation when buy or sell signals are formed is through divergence; this is the situation, when the trend of stock market price and trend of stock market indicator value are moving in opposite directions, which is a sign of weakening of the price trend.
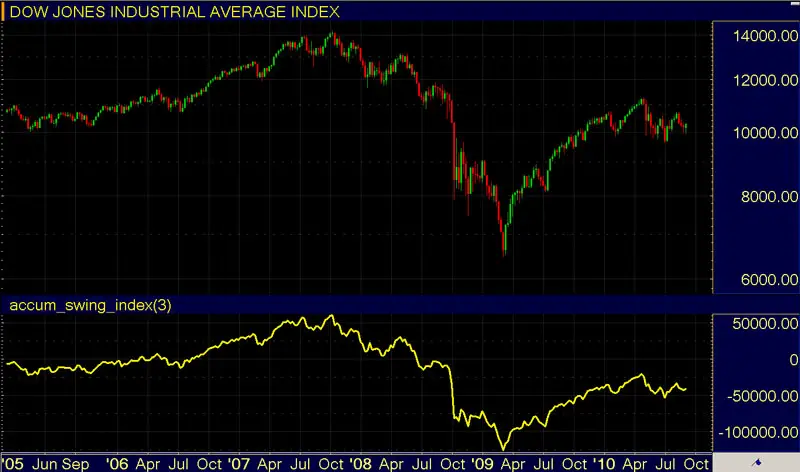
Accumulation/Distribution Line
This type of non-bounded stock market indicator measures the power of buyers to sellers (money flows ratio) by comparing the stock price and volume in a defined period. If the accumulation/distribution line is sloping upwards, buyers are more powerful then sellers.

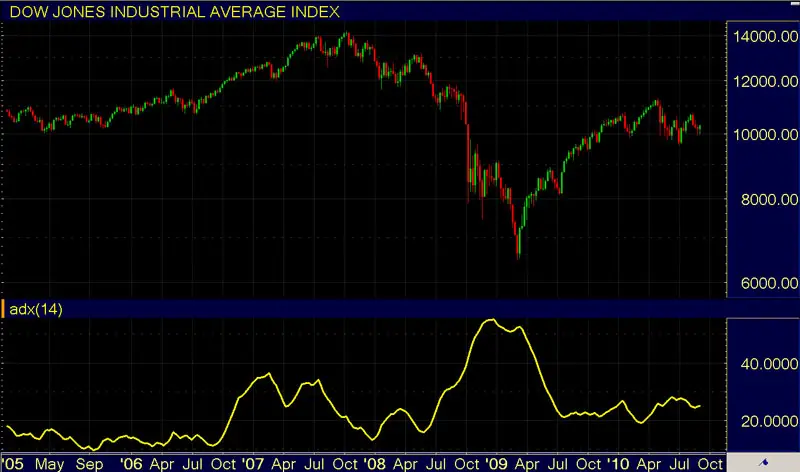
ADX - Average Directional Index
ADX measures the power (not direction!) of current stock market trend and current momentum. This stock market indicator is calculated out of two separate indicators; +DI measures uptrend and -DI which measures downtrend. The value of ADX ranges between 0 and 100, therefore it falls in a group of oscillators; ADX value below 20 signals week trend while ADX value above 40 signals a strong stock market trend.

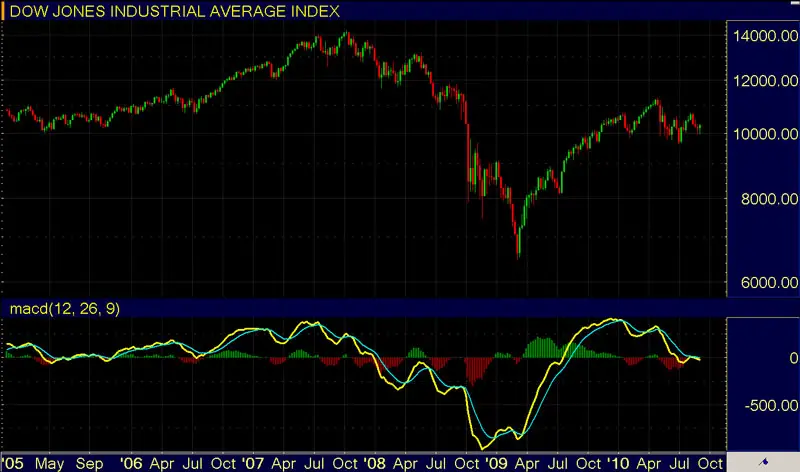
MACD - Moving Average Convergence Divergence
MACD is measuring the momentum in the stock out of the difference between two exponential moving averages, short-term and longer term. Positive value of MACD signals an upward momentum, since the short-term moving average is above the longer-term one. When the situation is turned around, when short-term MA is below longer-term one, this is a sign of downward momentum. When the two MA crosses each other, the MACD is crossing the centerline.

The values of moving averages can be adopted, depending on the volatility of the stock. More volatile stock requires shorter term MA and vice versa. However, usually used moving averages are 12 and 26 day EMA, while the signal line is normally based on 9 day EMA of MACD values.
MACD can be also plotted on the chart as histogram with bars only. Higher bars signal stronger momentum in the direction of the bar.
RSI - Relative Strength Index
RSI stock market indicator ranges between 0 and 100 and measures overbought (value above 70) and oversold (value under 30) situations in a specific stock, telling us if the stock price was pushed in either direction to fast and too far, signaling a trend reversal is on the horizon.

The calculation standard of RSI can be adopted, depending on the need of the trader. Normally it uses 14 trading days as the basis, but more active short-term traders can use fewer days (RSI will be more volatile in this case, signaling more buy and sell opportunities for shorter-term) and longer-term investors can use more days (RSI will be less volatile in this case, signaling less buy and sell opportunities, but they should last longer).
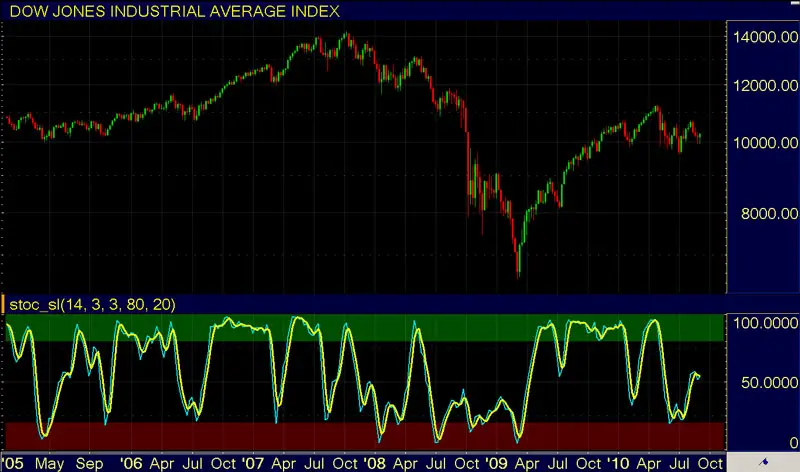
Stochastic Oscillator
Stochastic is another stock market indicator in a series of oscillators with bounded range of values between zero and 100. It measures momentum; when the upward trend is coming to an end, stochastic value is in the upper part of the range (above 80), signaling overbought conditions. On the other hand, when stochastic value is below 20, it signals oversold conditions and you can expect the stock price trend to change from downtrend to uptrend soon.

Stochastic oscillator consists out of two lines, the raw %K and more important %D, because it produces better signals. The calculation of stochastic is based on past 14 trading days, but this setting can be changed according to trader needs, as it is with other stock market indicators and oscillators also.
Recommended Reading - Recommended Reading - Recommended Reading - Recommended Reading
Back To Technical Stock Analysis Index...
Next step: Do you want to learn more about fundamental stock analysis?
Written by: Goran Dolenc
Do you find this content useful? Like! Tweet! Recommend! Share!
Back from Stock market Indicators to Investing in Stock Market
Back from Stock Market Indicators to Best Online Trading Site for Beginners home page


